
SmarTasty
Count calories with a photo
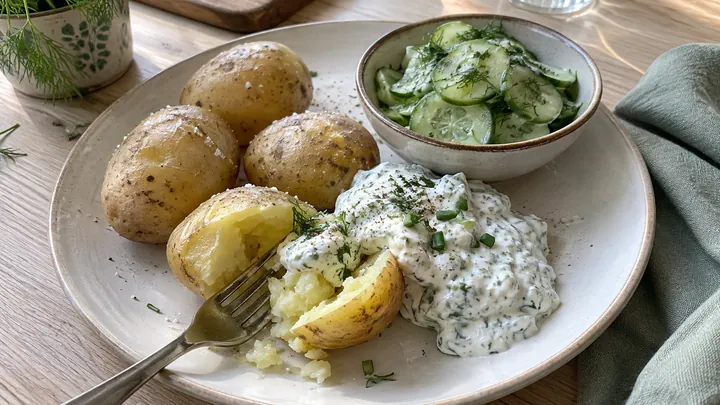
Our fullness score estimates how filling a recipe is – from protein, fibre and volume per calorie. Drinks and very rich dishes score lower.
The fullness score – shown on each recipe as “Fullness” – estimates how filling a recipe is per calorie. It counts protein and fibre per 100 kcal and the volume of the food: lots of water-rich veg means more food for the same energy.
Drinks, very small portions and dishes with lots of fat and sugar take points off. For recipes at the top of the scale, see filling recipes.
| What’s in the recipe | Points |
|---|---|
| Points added | |
| Protein – per 100 kcal: +1 from 3 g, +2 from 5 g, +3 from 8 g · +1 from 25 g | up to +4 |
| Fibre – per 100 kcal: +1 from 1.5 g, +2 from 3 g · +1 from 10 g | up to +3 |
| Volume – +2 up to 100 kcal per 100 g, +1 up to 150 kcal | up to +2 |
| Points taken off | |
| Drink – 6 at most – calories from drinks are less filling | −2 |
| Small portion – under 200 kcal | −1 |
| Fat and sugar – from 20 g each, as in cake | −1 |
| High energy density – from 250 kcal per 100 g | −1 |
Maximum 10 points. Shown on the recipe, but not part of the Health Score.
Filling recipes: From 7.
Every recipe starts at 3. Protein and fibre count per 100 kcal – for portions under 200 kcal we calculate with 200 kcal, so a clear broth doesn’t become “very filling”.
Volume comes from the energy density (kcal per 100 g). If the water content is missing, a recipe with lots of water-rich veg gets +1.
How full you feel also depends on how hungry you are, how you slept and how fast you eat.
The score follows fixed rules, the same for every recipe. It doesn’t replace medical or dietary advice.
A measure from a study by Susanna Holt (1995): how filling are different foods at the same 240 kcal? White bread is the reference (100%); boiled potatoes came top at 323%.
People make up for calories from drinks less than for solid food: after a drink, you usually don’t eat correspondingly less later.